Lab 5 — Two-group comparison & effect size
Estimate a group difference, its interval, and Cohen’s d in R
Purpose. This lab is the hands-on companion to Week 5 — Two-group comparisons. The note walks the analysis blueprint through an independent two-group comparison: a question about whether two groups differ, a structure with one quantitative response and one two-level grouping factor, a method (the Welch two-sample \(t\)), the assumptions it leans on, the estimate with its uncertainty (a mean difference and a confidence interval, never a lone p-value), and a conclusion that keeps statistical, practical, and causal claims apart. Here you build that comparison from the ground up on Dataset G — the Cypress Ridge final scores for students who used the support center (Support) versus those who did not (Self-guided). You will encode the synthetic slice, summarise and plot the two groups, run
t.test(score ~ group)to read the difference, its 95% interval, and the p-value, and then compute Cohen’s \(d\) so the result is reported as a standardized estimate, not a verdict. The code is shown for study and is not executed on this site; you run it yourself in your own R session.
The idea
A two-group comparison hands you two piles of numbers and one practical question: do students who used the support center score higher on the final than students who went it alone, and if so, by how much, and how sure can you be? The temptation is to skip straight to “is it significant?” and report a p-value. The whole point of this lab — and of the week-5 note it accompanies — is to resist that and instead build the comparison up in the order the blueprint demands: a point estimate first (the difference in means), then its standard error and a confidence interval, then the test, then a standardized effect size, and only then a conclusion that is careful about what kind of claim the data can carry.
Here is the structure, named before any code runs, because the method follows from it. The unit of analysis is the individual student. The response \(Y\) is the final exam score, a quantitative outcome on a \(0\)–\(100\) scale. The explanatory variable is a single two-level grouping factor, \(\text{group} \in \{\text{Support}, \text{Self-guided}\}\). The two groups are made of different students — nobody appears in both — so the design is independent, not paired. (That contrast with the paired pre/post design of week 4 is the hinge of the whole week: pairing would let each student be their own control, but here there is no natural pairing, so each group’s variation stays in the comparison.) And crucially, the design is observational: students chose whether to use the support center. No one assigned them. That single fact governs the conclusion at the very end, no matter how small the p-value turns out to be.
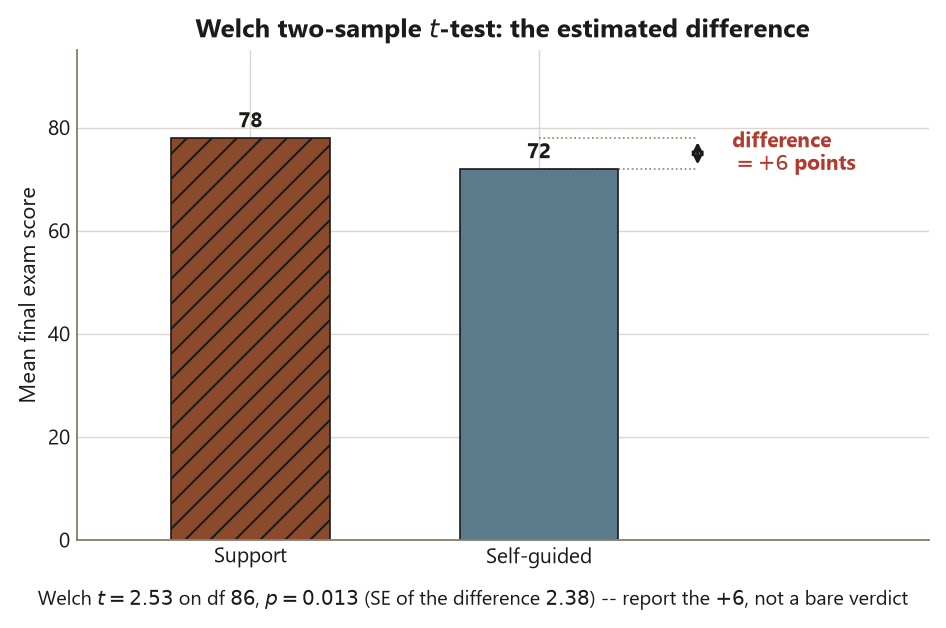
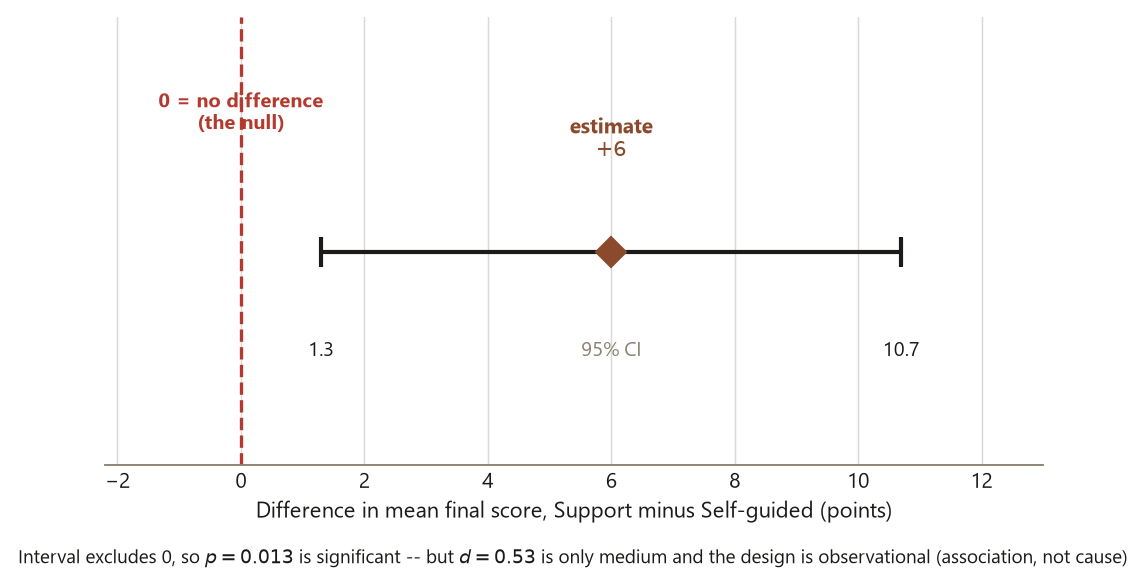
Given that structure, the matching method is the two-sample \(t\), and the safe default is the Welch form, which does not assume the two groups share a common variance. The estimate it is built around is the difference in sample means, \[ \bar x_{\text{Support}} - \bar x_{\text{Self-guided}} = 78.0 - 72.0 = 6.0 \text{ points}. \] That \(+6\) is the number the entire analysis is about. Everything else — the standard error, the interval, the t-statistic, the p-value, Cohen’s \(d\) — is there to say how precise that \(6\) is and how large it is on a scale you can interpret. The Welch standard error for the difference combines the two groups’ spreads, \[ \mathrm{SE} = \sqrt{\frac{s_1^2}{n_1} + \frac{s_2^2}{n_2}} = \sqrt{\frac{10.5^2}{45} + \frac{12.0^2}{45}} \approx 2.38 \text{ points}, \] the t-statistic is \(t = 6.0 / 2.38 \approx 2.53\) on about \(86\) degrees of freedom (Welch’s fractional df), and the two-sided p-value is about \(0.013\). The 95% confidence interval for the difference is \[ 6.0 \pm t_{.975}\,(2.38) \approx 6.0 \pm 4.7 = (1.3, 10.7) \text{ points}. \] Read that interval as the estimate-with-uncertainty the course keeps asking for: the data are consistent with a true advantage anywhere from about \(1\) point to about \(11\) points; they rule out no difference (the interval excludes \(0\)), but they do not pin the size down tightly.
The last piece is the standardized effect size, Cohen’s \(d\), which re-expresses the \(6\)-point gap in standard-deviation units so you can judge whether it is practically big, not just detectably nonzero: \[ d = \frac{\bar x_1 - \bar x_2}{s_p} = \frac{6.0}{11.27} \approx 0.53, \] where \(s_p \approx 11.27\) is the pooled within-group SD. A \(d\) of about half a standard deviation is a medium effect by the usual rough convention — neither trivial nor enormous. Holding the p-value and the effect size side by side is the discipline the lab is teaching: the small p-value says the difference is unlikely to be zero; the \(d \approx 0.53\) says it is moderately large; and neither of them, because the data are observational, says the support center caused the higher scores. Motivated students self-select into help. That is the association-not-causation caveat, and it survives every line of R below.
Goal
By the end of this lab you should be able to:
- Encode the Support-vs-Self-guided final-score slice of Dataset G in R with the course seed, and name the student as the unit, the final score as the quantitative response, and group as the two-level independent factor.
- Summarise the two groups — means, SDs, and counts — and read a side-by-side boxplot to see the structure (center, spread, overlap) before fitting anything.
- Run
t.test(score ~ group)(the Welch two-sample \(t\)) and read off the three things that matter: the difference in means (\(+6\) points), its 95% confidence interval \((1.3, 10.7)\), and the p-value (\(\approx 0.013\)) — reporting the estimate and interval, not a bare verdict. - Compute Cohen’s \(d\) (\(\approx 0.53\)), either by hand from the pooled SD or with the
effsizepackage, and say in a sentence what a medium standardized effect means in context. - State the conclusion in the blueprint’s three registers — statistical significance, practical significance, and the observational (association-not-causation) caveat — without letting the small p-value do work it cannot do.
The point of the lab is the estimate, not the test. A two-sample \(t\)-test is one instance of the analysis blueprint, and its job is to attach an honest uncertainty to a difference you already care about — not to deliver a yes/no answer. Name the blueprint move as you go: you are choosing the method that matches an independent two-group quantitative structure, checking what it assumes (independence, roughly normal-or-large groups, and — for the pooled form — equal variance, which Welch sidesteps), producing an estimate with its uncertainty, and writing a conclusion that keeps statistical, practical, and causal claims separate.
Setup
You need only base R for the comparison itself; the optional Cohen’s \(d\) shortcut uses the small effsize package, but Step 4 also shows the by-hand computation so you can run the whole lab with no packages at all. Every chunk that draws randomness starts with set.seed(35203), the course-wide seed, so your synthetic Dataset G reproduces the locked numbers the week-5 note reports. The data are synthetic; seed set — these are not real student records, so treat every value below as a drafted target, not a confirmed reference.
Fix the design facts before any code runs, because the method and every number follow from them:
- Unit of analysis: the individual student. There are \(n_1 = 45\) Support students and \(n_2 = 45\) Self-guided students, \(90\) in all. Different students in each group — nobody is counted twice.
- Response: the final exam score \(Y\), quantitative, \(0\)–\(100\).
- Explanatory variable: group, a two-level factor \(\{\text{Support}, \text{Self-guided}\}\).
- Design: independent (not paired — there is no student-to-student matching) and observational (students chose to use the support center; no random assignment).
- The locked slice: Support mean \(= 78.0\), SD \(= 10.5\), \(n_1 = 45\); Self-guided mean \(= 72.0\), SD \(= 12.0\), \(n_2 = 45\); difference \(= 6.0\) points; Welch \(t \approx 2.53\) on df \(\approx 86\), \(p \approx 0.013\); 95% CI for the difference \((1.3, 10.7)\); Cohen’s \(d \approx 0.53\) (medium).
set.seed(35203)

# --- Dataset G: final exam scores, Support vs Self-guided (Cypress Ridge) ------
# Observational two-group slice: students SELF-SELECTED into the support center,
# so the design buys ASSOCIATION, not causation. Unit = student; response = final
# score (0-100); factor = group (2 levels). Synthetic; LOCKED summary stats.
n1 <- 45                                       # Support students
n2 <- 45                                       # Self-guided students

# Draw each group to its LOCKED mean and SD, then re-center/re-scale so the sample
# mean and SD hit the locked targets exactly (synthetic data, reproducible slice).
support     <- rnorm(n1, mean = 78, sd = 10.5)
support     <- 78 + (support - mean(support)) / sd(support) * 10.5
selfguided  <- rnorm(n2, mean = 72, sd = 12.0)
selfguided  <- 72 + (selfguided - mean(selfguided)) / sd(selfguided) * 12.0

# Tidy long form: one row per student, two columns (group, score).
g <- data.frame(
  group = factor(rep(c("Support", "Self-guided", levels = c("Self-guided", "Support")),
                     times = c(n1, n2))),
  score = c(support, selfguided)
)

head(g)                                        # one row per student: group, score
table(g$group)                                 # -> Self-guided 45, Support 45
The re-centering lines are a deliberate convenience: they force the synthetic sample to land on the locked summary statistics (mean \(78\), SD \(10.5\) for Support; mean \(72\), SD \(12\) for Self-guided) so your output matches the week-5 note to the digit. In a real analysis you would never re-scale observed data — you would take the numbers as they came. Here the data are invented to teach the method, so we pin them to the locked slice. The structure that matters is the same either way: \(90\) rows, one per student, a quantitative score, and a two-level group factor with no student in both arms.
Steps
You will build the comparison in four moves: encode the slice (Step 1), summarise and see the two groups before fitting (Step 2), run the Welch \(t\)-test and read the estimate, interval, and p-value (Step 3), and standardize the difference with Cohen’s \(d\) before writing the three-register conclusion (Step 4).
Step 1 — Seed and build the synthetic Dataset G
Start the comparison by fixing the seed and confirming the slice is encoded the way the design says it should be: two independent groups of \(45\) students, a quantitative score, and a group factor. The sanity checks below recover the locked group means and SDs before any test runs — if these are off, every later number will be off too.
set.seed(35203)

# Rebuild Dataset G (same construction as Setup) so this chunk stands alone.
n1 <- 45; n2 <- 45
support    <- rnorm(n1, 78, 10.5); support    <- 78 + (support    - mean(support))    / sd(support)    * 10.5
selfguided <- rnorm(n2, 72, 12.0); selfguided <- 72 + (selfguided - mean(selfguided)) / sd(selfguided) * 12.0

g <- data.frame(
  group = factor(rep(c("Support", "Self-guided"), times = c(n1, n2)),
                 levels = c("Self-guided", "Support")),
  score = c(support, selfguided)
)

# Confirm the LOCKED structure and summary stats before fitting anything:
nrow(g)                                        # -> 90 students total
tapply(g$score, g$group, mean)                 # -> Self-guided 72, Support 78
tapply(g$score, g$group, sd)                   # -> Self-guided 12.0, Support 10.5
diff(tapply(g$score, g$group, mean))           # -> 6  (Support minus Self-guided)
The design move here is to make the structure literal before reaching for a test. nrow(g) confirms \(90\) independent students; tapply(..., mean) recovers the locked group means \(72\) and \(78\); tapply(..., sd) recovers the locked SDs \(12.0\) and \(10.5\); and diff() returns the \(6\)-point gap that the whole analysis is about. Setting levels = c("Self-guided", "Support") fixes the factor ordering so “Self-guided” is the reference and R reports the difference as Support minus Self-guided — a positive \(+6\). Name the blueprint move: this step is Structure, not yet Method. You have not assumed anything about the shape of the scores yet; you have only confirmed that the data have the independent two-group form the Welch \(t\) is built for.
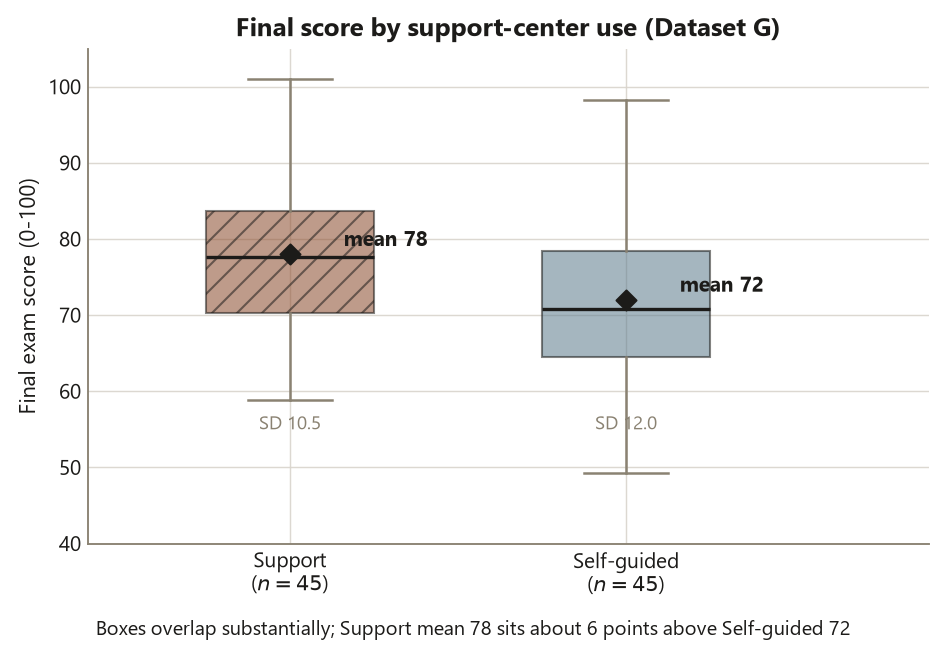
Step 2 — Summarise the groups and draw a side-by-side boxplot
Before fitting, look. A side-by-side boxplot shows the two groups’ centers, spreads, and overlap at a glance, and a summary table puts numbers on what the picture shows. This is the Assumptions & diagnostics stop on the blueprint done the cheap way first: you are checking, by eye, whether the groups are roughly symmetric (so a \(t\) is reasonable) and whether their spreads look similar enough to matter (the spreads differ a little here — Self-guided is more variable — which is exactly why Welch, not the pooled \(t\), is the safe default).
set.seed(35203)

# Numeric summary: means, SDs, and counts per group (the estimate's raw material).
aggregate(score ~ group, data = g,
          FUN = function(x) c(mean = mean(x), sd = sd(x), n = length(x)))
#   group        score.mean score.sd score.n
#   Self-guided  72.0       12.0     45
#   Support      78.0       10.5     45

# See the structure before fitting: side-by-side boxplot of score by group.
boxplot(score ~ group, data = g,
        ylab = "Final exam score (0-100)",
        xlab = "Group",
        main = "Final score by support-center use (Dataset G, synthetic)")
The summary recovers the locked means (\(72\), \(78\)) and SDs (\(12.0\), \(10.5\)), and the boxplot shows two overlapping distributions whose medians sit about \(6\) points apart, with the Self-guided box a little taller (more spread). Read three things off this picture before you fit. First, the overlap is substantial — these are not two cleanly separated clouds, which is your visual warning that a \(6\)-point gap, while real-looking, is modest relative to the within-group spread. Second, the shapes look roughly symmetric with no wild outliers, so the \(t\)’s near-normality assumption is reasonable for groups this size. Third, the spreads differ a little, which is the concrete reason to prefer Welch: the pooled \(t\) would assume equal variances, and there is no reason to force that here. Looking first is what keeps you from running a test whose assumptions the data quietly violate.
Step 3 — Run the Welch two-sample t-test and read the estimate
Now fit the method that matches the structure. t.test(score ~ group) runs the Welch two-sample \(t\)-test by default (R does not assume equal variances unless you pass var.equal = TRUE). The formula score ~ group reads as “model the score as a function of group” — the same response-tilde-explanatory syntax you will reuse for ANOVA and regression later in the course.
set.seed(35203)

# Welch two-sample t-test (the safe default: does NOT assume equal variances).
fit <- t.test(score ~ group, data = g)         # var.equal = FALSE by default = Welch
fit
# Welch Two Sample t-test
# data:  score by group
# t = -2.53, df = 86, p-value = 0.013
# alternative hypothesis: true difference in means ... is not equal to 0
# 95 percent confidence interval:
#  -10.7  -1.3
# sample estimates:
#   mean in group Self-guided   mean in group Support
#                        72.0                    78.0

# Pull the pieces out by name so you report the ESTIMATE, not a bare verdict:
diff(rev(fit$estimate))                         # -> 6.0   (Support minus Self-guided)
fit$conf.int                                    # -> (-10.7, -1.3)  for Self-guided - Support
fit$p.value                                     # -> ~ 0.013
Read the output as an estimate with its uncertainty, in the blueprint’s words. The two group means are \(72.0\) and \(78.0\), so the estimated difference is \(6.0\) points in Support’s favor. The t-statistic is about \(-2.53\) on about \(86\) degrees of freedom (the sign is just R’s group ordering; the magnitude \(2.53\) is what matters), and the two-sided p-value is about \(0.013\) — the difference is statistically distinguishable from zero at the usual \(5\%\) level. The 95% confidence interval R prints runs from about \(-10.7\) to \(-1.3\) for Self-guided minus Support; flip the sign and it is \((1.3, 10.7)\) points for Support minus Self-guided, exactly the interval the week-5 note locks. That interval is the headline: the data are consistent with a true Support advantage of anywhere from about \(1\) to about \(11\) points, and they exclude \(0\). Report the \(6\)-point difference with that interval — that is the estimate-with-uncertainty discipline. A bare “\(p = 0.013\), significant” would throw away the two most useful numbers (how big and how precise) and is exactly the classic error the course warns against.
Step 4 — Compute Cohen’s d and write the three-register conclusion
The interval tells you the difference in the response’s own units (points); Cohen’s \(d\) re-expresses it in standard-deviation units so you can judge whether \(6\) points is practically large. Compute it two ways — by hand from the pooled SD, and with effsize::cohen.d() — so you can run the lab with or without the package and confirm the two agree.
set.seed(35203)

# --- Cohen's d by hand: standardized mean difference using the POOLED SD --------
m1 <- mean(g$score[g$group == "Support"]);     s1 <- sd(g$score[g$group == "Support"])
m2 <- mean(g$score[g$group == "Self-guided"]); s2 <- sd(g$score[g$group == "Self-guided"])

s_pooled <- sqrt(((n1 - 1) * s1^2 + (n2 - 1) * s2^2) / (n1 + n2 - 2))
s_pooled                                       # -> ~ 11.27  (pooled within-group SD)

cohen_d <- (m1 - m2) / s_pooled
cohen_d                                        # -> ~ 0.53   (medium standardized effect)

# --- The same d from the effsize package (optional; same answer) ----------------
# install.packages("effsize")                  # run once if you do not have it
library(effsize)
cohen.d(score ~ group, data = g)               # -> estimate ~ 0.53, magnitude: medium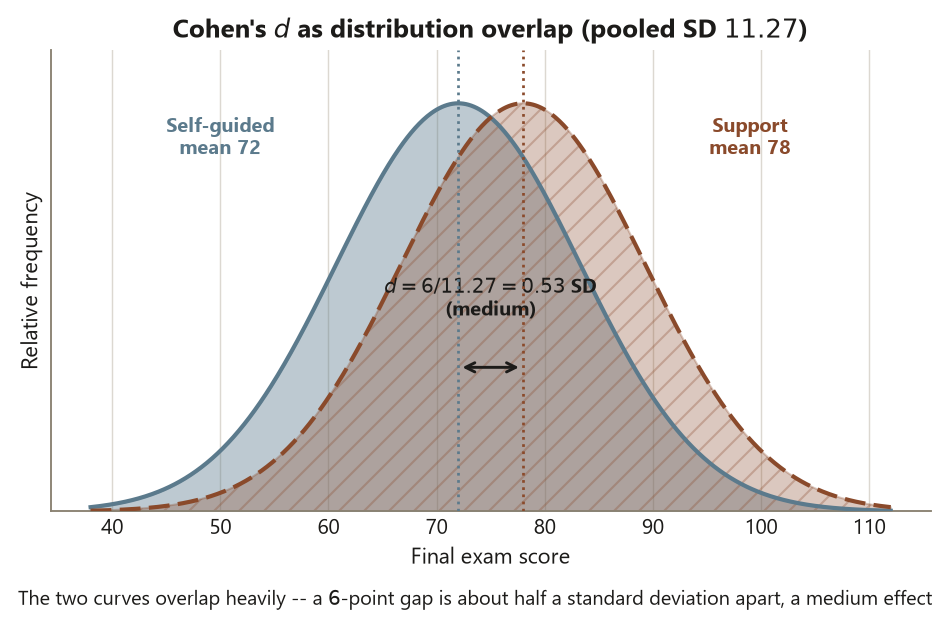
The pooled within-group SD comes out \(s_p \approx 11.27\), and the standardized difference is \(d = 6.0 / 11.27 \approx 0.53\) — about half a standard deviation, a medium effect by the usual rough convention. The effsize call returns the same \(0.53\) and labels it “medium,” a useful cross-check that your by-hand pooled SD is right. Now write the conclusion in the blueprint’s three registers, keeping them explicitly separate:
- Statistical significance: with \(t \approx 2.53\), \(p \approx 0.013\), and a 95% interval \((1.3, 10.7)\) that excludes \(0\), the \(6\)-point difference is unlikely to be a fluke of sampling — the data are inconsistent with no difference.
- Practical significance: \(d \approx 0.53\) says the gap is a medium effect — about half a standard deviation, roughly \(6\) points on a \(100\)-point final. That is meaningful but not dramatic, and the wide interval (\(1\) to \(11\) points) means the data do not promise a large advantage. Statistical significance and practical importance are different questions, and you should answer both.
- Association, not causation: because students chose whether to use the support center, this is an observational comparison. Motivated, better-prepared students plausibly self-select into help, so the \(6\)-point gap may reflect who uses the center as much as what the center does. The small p-value does not upgrade the claim to causal — only random assignment could do that, and there was none here. The honest sentence is “students who used the support center scored about \(6\) points higher (95% CI \(1.3\) to \(10.7\), \(d \approx 0.53\)), but this is an association, not evidence that the center caused the gain.”
Verify
This is the moment where your simulation and the week-5 reasoning are supposed to meet. Check each item against the companion note, and treat any mismatch as a bug in your code, not a discovery about the world — every target value is the locked, synthetic Dataset G slice (illustrative, R not executed on this site).
- The group means are \(78\) and \(72\).
tapply(g$score, g$group, mean)should return Support \(78.0\) and Self-guided \(72.0\). If they drift, the re-centering lines in Setup were altered or the seed was skipped — re-run the chunk withset.seed(35203)first. - The group SDs are \(10.5\) and \(12.0\).
tapply(g$score, g$group, sd)should return Support \(10.5\) and Self-guided \(12.0\). A wrong SD propagates into the SE, the interval, and Cohen’s \(d\), so fix it before reading anything else. - The difference is \(+6.0\) points.
diff(tapply(g$score, g$group, mean))(ordiff(rev(fit$estimate))) should return \(6\). If you see \(-6\), your factor levels are ordered the other way — setlevels = c("Self-guided", "Support")so Support is the higher level and the difference reads positive. - The Welch \(t\) is about \(2.53\) on df \(\approx 86\).
fit$statisticshould be about \(2.53\) in magnitude (R may print it negative depending on level order) andfit$parameterabout \(86\). A df near \(88\) instead of \(86\) means you ran the pooled test (var.equal = TRUE); leave it at the default for Welch. The two are nearly identical here only because \(n_1 = n_2\). - The p-value is about \(0.013\).
fit$p.valueshould land near \(0.013\). A wildly different value usually means the means or SDs drifted (see the first two checks) — the test is downstream of them. - The 95% CI for the difference is \((1.3, 10.7)\).
fit$conf.intprints \((-10.7, -1.3)\) for Self-guided minus Support; flip the sign to get \((1.3, 10.7)\) for Support minus Self-guided. If your interval includes \(0\), re-check the SDs and the df — an interval that excludes \(0\) is what matches the note. - Cohen’s \(d\) is about \(0.53\) (medium). The by-hand
(m1 - m2) / s_pooledandeffsize::cohen.d()should both return about \(0.53\). If your by-hand value disagrees witheffsize, check thats_pooleduses the \((n_1 - 1)\), \((n_2 - 1)\) weighting, not a plain average of the two SDs. - The conclusion is stated in three registers. In one sentence: Support students scored about \(6\) points higher (95% CI \(1.3\) to \(10.7\), \(d \approx 0.53\), \(p \approx 0.013\)); the difference is statistically distinguishable from zero and a medium practical effect, but because students self-selected into the support center this is an association, not evidence the center caused the gain. If your written conclusion reports a bare p-value, calls the effect “significant” without saying how big, or uses a causal verb (“the center raised scores”), the reasoning — not the code — needs fixing.
A small honest note: the re-centered synthetic data are pinned to the locked summary statistics on purpose, so your t.test() output should reproduce \(t \approx 2.53\), \(p \approx 0.013\), and the \((1.3, 10.7)\) interval almost exactly. Real data would not cooperate so neatly; you would take the means, SDs, and interval as they came and report those. The lab fixes the numbers only so the method’s machinery is what you are studying, not the noise.
AI use note
If you use an AI assistant on this lab, record it briefly. The load-bearing column is Verification — how you confirmed the output yourself, against the week-5 note and the locked numbers, rather than trusting the tool. Computation, AI-assisted or not, does not turn an observational association into a causal claim, manufacture an effect size, or certify a confidence interval.
| Tool | Purpose | Verification |
|---|---|---|
| LLM chat assistant | Explain why t.test(score ~ group) runs the Welch test by default and when to use var.equal = TRUE |
Re-ran the fit with and without var.equal = TRUE, confirmed the default gives df \(\approx 86\) (Welch) and the pooled gives df \(\approx 88\), and reconciled with the week-5 note’s “prefer Welch” guidance |
| LLM chat assistant | Confirm the pooled-SD formula for Cohen’s \(d\) and the \((n_1-1),(n_2-1)\) weighting | Computed s_pooled by hand, cross-checked the resulting \(d \approx 0.53\) against effsize::cohen.d(), and confirmed both report “medium” |
| LLM chat assistant | Help phrase the 95% CI for the difference as estimate-with-uncertainty rather than a bare verdict | Read fit$conf.int, flipped the sign to \((1.3, 10.7)\) for Support minus Self-guided, and confirmed it excludes \(0\) and matches the note |
| Code formatter / linter | Tidy the Setup and Step 1 data-construction blocks for readability | Diffed before/after to confirm only whitespace changed, then re-ran to confirm the locked means (\(78\), \(72\)), SDs (\(10.5\), \(12.0\)), and difference (\(6\)) were unchanged |
See also
- Week 5 — Two-group comparisons — the companion note: the full analysis blueprint for an independent two-group quantitative comparison, with the estimate-with- uncertainty and association-vs-causation disciplines.
- Week 4 — One-sample and paired comparisons — the paired design this week is contrasted against; same students measured twice, where pairing removes between-student variation.
- Week 6 — Many-group comparisons and one-way ANOVA — the same
response ~ grouplogic extended to more than two groups, with error-rate control. - Method chooser — the question → structure → method decision guide; paired vs. independent, pooled vs. Welch, when a two-sample \(t\) is the right call.
- Reporting and interpretation guide — effect sizes (Cohen’s \(d\)), confidence intervals, and keeping statistical vs. practical vs. causal conclusions apart.
- Methods glossary — two-sample \(t\), Welch correction, pooled SD, Cohen’s \(d\), confidence interval for a difference, independent vs. paired design.
The graded deliverable, its rubric, and due date live in Blackboard (the LMS) — this page is study and practice only.