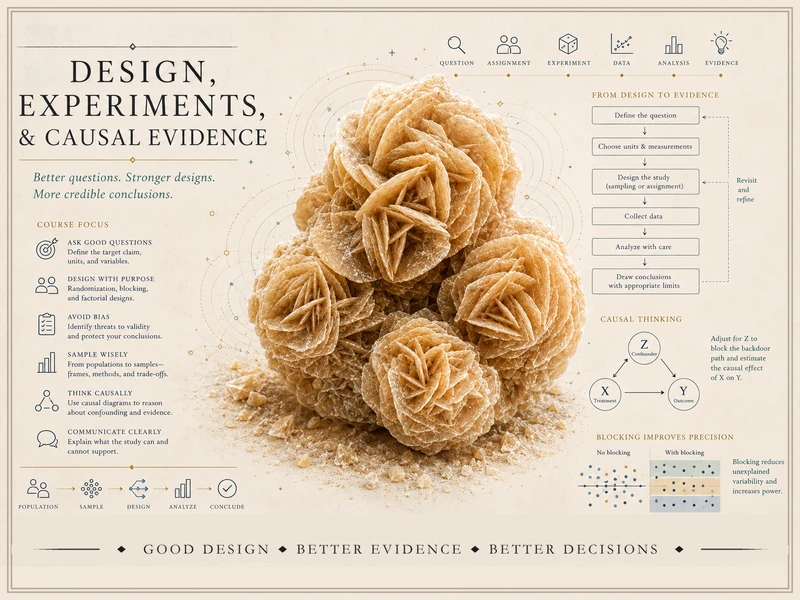
Design, Experiments & Causal Evidence
How statistical evidence is produced — from a question and a design to a defensible claim
Good statistical analysis does not begin with a p-value, a model, or a software procedure. It begins with a question, a population or process of interest, a unit of analysis, measurements, a design, and assumptions about how the data were generated. This course teaches you to reason about that whole chain — to recognize what a study design can and cannot support.
What this course is
This is a course about how statistical evidence is produced. It modernizes the traditional design-of- experiments course by placing experiments inside a broader evidence framework: experiments stay central because random assignment is one of the strongest tools we have for causal evidence, but most real statistical work also involves observational data, imperfect measurement, incomplete sampling frames, missing data, and practical limits. You learn not only how to analyze a designed study, but how to recognize what any design can support.
We build the reasoning and the tools in order: statistical questions and units of analysis; measurement and operational definitions; the signature distinction between random sampling and random assignment; bias, confounding, and validity; completely randomized experiments; blocking, paired, and factorial designs; interactions; observational studies; causal diagrams and backdoor reasoning; surveys and sampling frames; stratified and cluster sampling; missing data and nonresponse; study critique; and the design memo that states what a study supports and what it does not.
The emphasis throughout is reasoning, interpretation, and communication. You will evaluate study designs, identify threats to validity, explain why randomization matters, distinguish sampling from assignment, analyze simple experimental and observational data, critique claims, and write design memos that connect statistical methods to evidence.
We use R and Quarto to run randomizations, demonstrate blocking, simulate sampling schemes, and adjust for confounding. But this is a design-and-evidence course, not a programming course and not a regression- modeling course: software output does not rescue a weak design, and every line of code is in service of a design idea.
What you will be able to do
By the end of the term, you should be able to:
- Translate a research question into units of analysis, variables, measurements, comparisons, and a target claim.
- Distinguish populations, samples, treatment and comparison groups, outcomes, covariates, and experimental units.
- Explain the difference between random sampling and random assignment, and why each supports a different kind of conclusion.
- Identify threats to validity — selection and measurement bias, confounding, attrition, nonresponse, missing data, and post-treatment adjustment.
- Design and analyze basic experiments, and use blocking, pairing, and factorial designs to sharpen and structure comparisons.
- Interpret main effects and interactions in designed studies.
- Evaluate observational studies, distinguish association from causal evidence, and use simple causal diagrams to reason about confounding, adjustment, and backdoor paths.
- Reason about sampling frames, coverage, and nonresponse, and compare simple random, stratified, cluster, and multistage sampling.
- Critique a study claim and write a clear design memo — what the study supports, what it does not, and what evidence would strengthen it.
How the site is organized
This public site has three working areas, reachable from the sidebar:
- Notes — the weekly instructional spine. Each week poses a design question, develops the concept, works it on a recurring campus study, names a common mistake, and offers ungraded self-checks. Start here.
- Labs — the hands-on strand. Four short labs in R and Quarto let you build a randomization reference distribution, see how blocking sharpens a comparison, simulate confounding and adjustment, and compare sampling designs. Code is shown for study; you run it in your own session.
- Resources — a design and causal-evidence glossary, a one-page study-design reference that lays the design families side by side, and a guide to drawing and reading causal diagrams. Keep these open while you read.
A recurring campus world
To keep the ideas concrete, the course returns to one synthetic campus world — an effort to improve student learning and wellbeing — studied three ways: a randomized experiment (a study-skills workshop, which earns causal claims), an observational study (who chooses to use the tutoring center, where confounding lurks), and a survey (study habits and sleep, where sampling and nonresponse decide what we can claim). All data are synthetic, with seeds set; the same questions seen through three designs make the design choice visible.
Software
We use R (via RStudio or Posit Cloud) together with Quarto. No prior coding experience is assumed — the work is scaffolded and the code is explained as it goes. On this site, R chunks are shown as static teaching code and are not executed in place; you run them in your own session.
Source and attribution
These notes are the course’s own synthesis, grounded in but not copied from open and freely available sources:
- Primary materials: instructor notes, examples, and design guides (the course’s own work).
- Design & sampling concepts: Introduction to Modern Statistics, 2nd ed. (Çetinkaya-Rundel & Hardin) — free at openintro-ims.netlify.app. License: CC BY-SA 3.0.
- Randomization & sampling labs: Statistical Inference via Data Science: A ModernDive into R and the Tidyverse, 2nd ed. (Ismay, Kim & Valdivia) — free at moderndive.com/v2. License: CC BY-NC-SA 4.0.
- Optional advanced causal reference: Causal Inference: What If (Hernán & Robins) — freely readable online; named and linked only.
All example data are synthetic with seeds set; the prose here is original.
A note on what is public here
Everything on this site is public and ungraded — study material only. You will not find graded prompts, answer keys, rubrics, point values, or schedules here. The operational side of the course — graded design checkpoints, quizzes, design memos and homework, applied design labs, the midterm, the final design project, and the final exam, along with all dates and submissions — lives in Blackboard (the LMS), which is authoritative. If this site and Blackboard ever disagree, follow Blackboard.
Every numeric value in the recurring example studies is a synthetic instructional example (fixed seed), chosen to illustrate design reasoning rather than measured from real students.