Statistical Inference
Likelihood, simulation, and decisions — learning from data under uncertainty
Every dataset is a keyhole view of something larger — a population, a process, a truth we cannot observe directly. Statistical inference is the disciplined craft of reasoning back through that keyhole: from a sample to a defensible statement about what generated it, with the uncertainty of that step made explicit rather than hidden. It is how a single survey becomes a claim about a campus, how a handful of measurements becomes an estimate with a margin of error attached, and how we decide, honestly, when the evidence is strong enough to act on.
What this course is
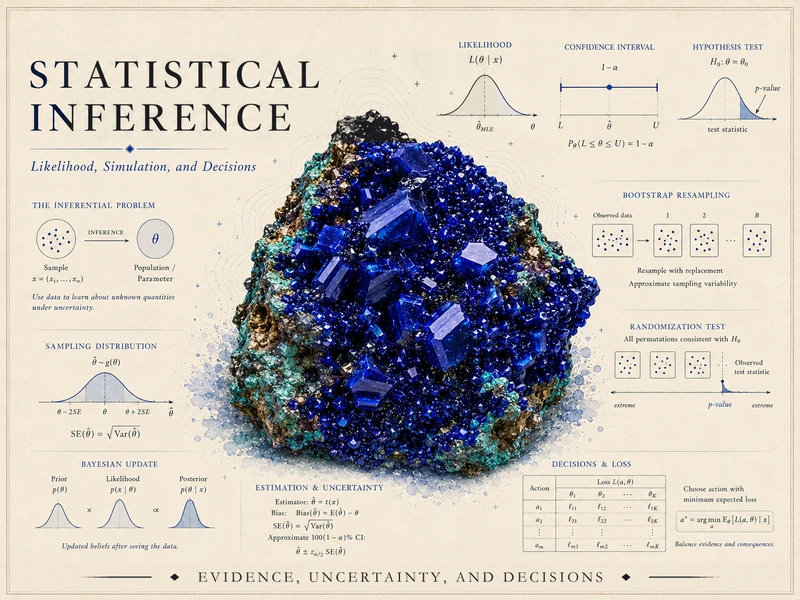
This course teaches inference as a pluralistic discipline. There is more than one coherent way to reason from data to conclusions, and this course does not declare any one of them uniquely correct. You will learn the classical frequentist toolkit — sampling distributions, estimators, confidence intervals, hypothesis tests — alongside likelihood-based reasoning, simulation-based methods (bootstrap and randomization), and an introduction to Bayesian updating. Each framework asks a slightly different question of the same data, and part of the work of this course is learning to tell those questions apart.
Throughout the semester we follow one recurring synthetic world: the MAC Study, a research team’s investigation of how students use UA Little Rock’s Math Assistance Center. A population parameter — an average visit duration, a usage rate — is treated as genuinely unknown, and a sample is treated as the only evidence in hand, exactly as a real analyst would face it. The same sample numbers return week after week, so that each new method (estimation, confidence intervals, testing, bootstrap, permutation, Bayesian updating) attaches to a world you already know rather than a fresh one.
What you will be able to do
By the end of the term, you should be able to:
- Describe a sampling distribution and explain why a statistic computed from a random sample is itself a random variable with its own spread.
- Evaluate an estimator by its bias, variance, and mean squared error, and explain the trade-off a biased estimator can offer.
- Write down a likelihood function for simple models, and derive and interpret a maximum likelihood estimate.
- Construct a confidence interval for a mean or a proportion, and state — correctly — what a confidence level does and does not promise.
- Carry out a hypothesis test, interpret a p-value without overclaiming, and connect Type I/Type II error rates to the power of a test.
- Build a bootstrap confidence interval and a randomization (permutation) test from resampling principles, without leaning on a formula you cannot justify.
- Update a Bayesian prior into a posterior using data, and summarize a posterior with a mean, SD, and credible interval.
- Compare what frequentist, likelihood-based, simulation-based, and Bayesian approaches each say about the same question, and recognize when their answers agree and when they do not.
- Connect an inference to a decision: state a simple loss or decision rule and explain what “acting on” an estimate or a test result actually commits you to.
- Communicate an estimate, an interval, or a test result to a nonspecialist audience without overstating what the data show.
How the site is organized
This public site has three working areas, reachable from the sidebar:
- Notes — the weekly instructional spine. Each week poses a question, develops the concept, works examples (including the recurring MAC Study), names a common mistake, and offers ungraded self-checks. Start here.
- Labs — the simulation strand. Five short labs in R and Quarto let you confirm the theory by simulating sampling distributions, likelihood curves, bootstrap intervals, randomization tests, and a Bayesian posterior. Code is shown for study; you run it in your own session.
- Resources — a notation glossary, a formula reference, and setup instructions for R and Quarto. Keep these open while you read.
Software
We use R (via RStudio or Posit Cloud) together with Quarto for the simulation work. No paid homework platform is used in this course. Software is a support for inference, not the center of it: simulation lets you watch a sampling distribution, a bootstrap distribution, or a posterior take shape, and checks reasoning you have already worked out by hand. In the notes and labs on this site, R chunks are shown as teaching examples and are not executed in place; they are written in base R, carry a set seed (set.seed(35103)), and are reproducible when you run them yourself.
Source and attribution
These notes are the course’s own synthesis, grounded in but not copied from three free, openly licensed sources, each used at a different intensity:
- Primary spine — MIT OpenCourseWare 18.05, Introduction to Probability and Statistics (CC BY-NC-SA 4.0, free). Used selectively across every week of the course to ground scope, sequence, and terminology.
- Secondary, genuinely used co-source — ModernDive, Statistical Inference via Data Science: A ModernDive into R and the Tidyverse, 2nd ed. (Ismay, Kim, Valdivia), CC BY-NC-SA 4.0, free. Named and linked alongside 18.05 in the weeks where its strengths are the week’s center: simulation-based inference, hypothesis testing, bootstrapping, and randomization, plus the closing synthesis week.
- Optional supplementary review — OpenIntro IMS, Introduction to Modern Statistics, 2nd ed. (Çetinkaya-Rundel & Hardin), CC BY-SA 3.0, free. Pointed to occasionally, in the more foundational and review weeks, always as an optional gentler alternative rather than required reading.
All example data on this site are synthetic, with a seed set. See the Syllabus for full attribution.
Public vs. graded
Everything on this site is public and ungraded — study material only. No graded prompts, answer keys, rubrics, point values, or due dates appear here. Graded inference checkpoints, quizzes, homework, labs, the midterm, the project, and the final live in Blackboard (the LMS), which is authoritative for due dates, submissions, and grades. If this site and Blackboard ever disagree, follow Blackboard.